
|
|
|
#1
 09-20-2022, 06:47 PM
|
|||
|
|||
|
How to read VCR signal layout
Hello! I am new here! I am interested in all things video, in particular old analog video recorders and cameras, as well as digital camcorders. I have a YouTube channel, but I don't want to advertise it now, as it may seem way too amateurish to the members.
Several of my late videos regarded analog VTRs, and the deeper I get into why and how some of them are better/worse than others, and what the differences are, the deeper I get into their specs and into how they work. I've never studied electronics, so understanding some things is hard, especially when several things happen at once, like modulating of this with this, and all this occurs in time. Reading a bit about analog broadcast TV, I think I understand where the bandwidth requirement comes from, it is basically number of elements ("pixels") in line times the number of lines times the number of frames per second, so about 6 or 7 or 8 MHz depending on a system. Do I understand correctly, that on the picture below each particular frequency describes a pixel, and amplitude describes brightness? So, basically, the picture below can define a whole second of broadcast video, or in other terms, a whole frame? (Or field, whatever, not important at this point). 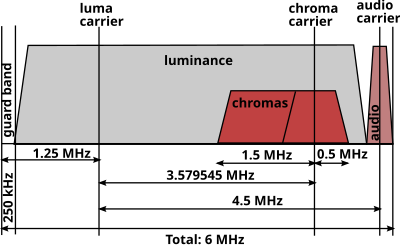 Moving on to VTR, I have a question of how to read the signal graph of a typical "color-under" VTR: 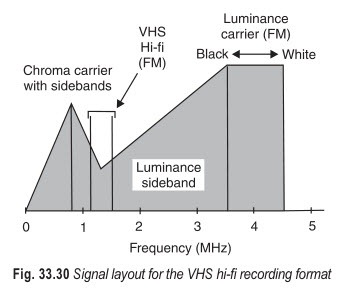 Does it describe a whole frame/field, or a single pixel? From what I've read, brightness of a pixel is not described with amplitude, but rather with frequency, so the range from luminance tip (black) and white frequency describe brightness range. So, a range between, say, 3.5 MHz and 4.5 MHz, which is 1 MHz, describes the whole range of brightness... for a single pixel? For a pair of pixels? What is luminance sideband is for in this case? On another hand, I read about, say, VHS, that it has deviation of 1 MHz, but luma range of 3 MHz. Ok, what does it tell me? In other place I read that for analog television resolution can be calculated as roughly 80 LWPH per 1 MHz, so 3 MHz means 240 lines, it adds up. But how exactly to read this information on the graph? If I divide 1,000,000/480/30 = 70, which is close to 80. Is it where this number comes from? But in this case this means that bandwidth describes one scanline. So, the graph can be considered a "photo" of one scanline sweep, where sweeping from left edge of the screen to the right corresponds to frequencies from the left edge of the luminance band to the right? Is this correct? But in this case how do describe brightness for all of these pixels, if brightness is described as frequency in the 3.5 to 4.5 region, so I can have only one frequency there for every moment it time? I am lost here. If someone can explain it in layman terms, I would be very grateful! Another thing, which is related to these graphs, is increase in resolution in "hi-band" formats. This is why I started to look into these graphs at the first place. For formats like SVHS, Hi8, SuperBeta, Umatic SP some of these things have been done:
Thanks! 
|
|
#2
09-20-2022, 08:02 PM
|
||||
|
||||
|
You need to learn the difference between an electrical signal vs time and its spectrum of frequencies.
If you look at a video signal with an oscilloscope, you can pick out the time sequence of frames, fields, lines, and the particular spot on the screen left to right. The diagrams you posted are frequency spectra, and represent a long term average of the different frequencies in the signals. In general, a lower frequency (towards the left) represents a coarse repeating pattern of lines or dots in the picture, and higher frequencies represent finer patterns. When such a signal is modulated on a carrier, it generates new frequencies spaced up and down from the carrier frequency. Last edited by old_tv_nut; 09-20-2022 at 08:12 PM.
|
|
#3
09-20-2022, 08:06 PM
|
||||
|
||||
|
Was the resolution improved because the overall width of luminance band, from the very left edge that touches chroma, to the very right, was extended?
Basically, yes. But the luminance in tape machines is FM modulated, so it also reduced the noise level.
|
|
#4
09-20-2022, 08:10 PM
|
||||
|
||||
|
another thing, in some formats luminance carrier deviation was increased. Do I understand correctly that this only affects the contrast? Or in other words, it affects dynamic range, considering that more "steps" is available? If this is true, why the increase in carrier deviation is always mentioned together with the increase in luminance resolution? The resolution does not depend on deviation per se, it depends on the overall width of the luminance band, which is expanded if the Y carrier is moved up and the deviation is increased... I see, so it is kind of a secondary effect. But the deviation per se does not improve the resolution?
The FM modulation of the luminance in video tape is called "narrow band" because the FM deviaton is in the same order as the bandwidth of the video baseband. Compare this to FM radio, where the deviation is larger than the baseband audio frequencies. The overall bandwith of the video tape FM luminance is a combination of the baseband signal bandwidth and the deviation. If the carrier is too low in frequency the combination can suffer distortion.
|
|
#5
09-20-2022, 08:49 PM
|
||||
|
||||
|
Quote:
 If you can point to the graph and say "this is this" and "this is that", I will be grateful. If you can point to the graph and say "this is this" and "this is that", I will be grateful.Quote:
Quote:
Quote:
Last edited by DVtyro; 09-20-2022 at 11:48 PM.
|
| Audiokarma |
|
#6
09-21-2022, 10:55 AM
|
||||
|
||||
|
It's very difficult to give you a complete course in signal and modulation theory of video recording (or in general) in this forum. Give me some time and I'll try to find some books that are still available that you could buy.
What references do you have now?
|
|
#7
09-21-2022, 11:07 AM
|
||||
|
||||
|
The diagrams you posted show the range of frequencies which MAY be present. What energy is actually in those bands depends on the picture content.
First diagram: In the narrow band FM of the luminance signal, the slowly varying parts of the baseband signal produce the range of frequencies from 3.5 to 4.5 MHz, as you stated. But modulation by higher frequencies (fine detail) produces the luminance sidebands shown. You really need college-level math (Bessel functions) to determine what these are. If the system does not pass these sidebands, the fine detail will be filtered out. https://www.johndcook.com/blog/2016/...-an-fm-signal/
|
|
#8
09-21-2022, 01:58 PM
|
|||
|
|||
|
@old_tv_nut, frankly, my math is too rusty get into it again. I do not strive for understanding these graphs on a level of a video engineer, but I would like to be able to compare two machines looking at the graphs. After all, these graphs were published in all pop-sci magazines, and a regular reader was supposed to understand them. All I want is conceptual understanding.
Please, see the attached picture.
|
|
#9
09-21-2022, 03:43 PM
|
||||
|
||||
|
Answers in bold [EDIT - AK changes all-bold to lower case]
Quote:
Last edited by old_tv_nut; 09-21-2022 at 06:34 PM.
|
|
#10
09-21-2022, 05:21 PM
|
|||
|
|||
|
Quote:
|
| Audiokarma |
|
#11
09-21-2022, 08:20 PM
|
||||
|
||||
|
You're asking way too many questions at once. It's sensory overload reading it all.
There are some major fundamental things you're missing if you are describing analog TV and video information interms of pixels. There are no pixels in analog TV and they aren't a great way to quantify analog video system performance. Television is a raster, which is a stack of scan lines (525 of them). A scan line is a continuous horizontal stripe of phosphor and analog information there are no defined pixel like boxes. The brightness is infinitely variable and can be any value at any physical location on the line. This is super apparent on a monochrome only TV. Color TVs have the illusion of pixels, but no actual pixels.... Basically to achieve color since you can't have one single phosphor make all 3 primary colors with independent control most color TVs have 3 different colors of phosphor arranged in a dot or stripe grid...The grid is NOT pixels, but merely a necessary side effect of needing 3 different color phosphors. They basically try to size the grid small enough that it won't noticably limit detail (the 15GP22 and the CRT in the GE Portacolor we're actually not small enough to prevent reduction in picture quality). Projection sets would use 3 monochrome CRTs as would field sequential sets that would rapidly show 3 complete video frames on a monochrome CRT with a spinning wheel with 3 different color filters in front of it such that on the green color frame the green color filter would be in front of the tube and tint it's light green, the blue filter in front of the screen when the blue video field was on screen, ETC. Because a video dark to bright transition can be anywhere on the line digitizing that video can actually reduce resolution as the pixels in the digitizer may not line up with the transitions in a way that is can capture them or there may not be as many pixels as transitions thus there isn't a box to put some of the transitions into. The horizontal line frequency is 15,750Hz so a horizontal line takes (time in seconds)= 1/(frequency in Hz)....Minus the duration of a complete horizontal sync pulse. If you convert the non-sync portion of the horizontal line time back to a frequency F=1/T vou can divide the video frequency by the visible line frequency and get the number of black/white transitions (number of vertical lines that can be displayed) at that video frequency. (I think I have that math right correct me if I'm wrong) There's probably other things I could explain but I've already forgotten 75% of what you wrote.
__________________
Tom C. Zenith: The quality stays in EVEN after the name falls off! What I want. --> http://www.videokarma.org/showpost.p...62&postcount=4
|
|
#12
09-21-2022, 09:57 PM
|
|||||
|
|||||
|
Quote:
Quote:
How TV bandwidth is calculated? Suppose the frame is square, H high and L wide with number of lines N. Each line has LN/H elements a.k.a. pixels. Because there are N lines, total number of elements is LN^2/H. One period is good for two elements ("pixels"), so we need LN^2/(2H) periods per one frame. The frequency should be LN^2*n/(2H), where n is frame rate. Correcting for 4/3 display aspect ratio we get 4*N^2*n/(3*2) Hz. Say, for NTSC we get 4*525^2*30/6 = 5.5 MHz. Quote:
Quote:
Quote:
|
|
#13
09-21-2022, 10:27 PM
|
||||
|
||||
|
"Pixels" implies a fixed location along the scanning line of the light or dark spot. In analog TV, the location is not fixed and can vary location left or right infinitesimally. Calling them pixels is misleading.
Analog TV resolution is specified in lines (two per black/white pair) per picture height or per picture width. Due to the bandwidth limit of NTSC broadcast, the system can produce about 440 lines per picture width, that is, 220 black spots and 220 white spots. Because the resulting spots can be infinitesimally placed leftward or rightward, the sampling rate of a visually equivalent digital signal needs to be higher than the Nyquist rate (twice the limiting analog frequency) to prevent visible aliasing patterns. Standard definition digital video recording uses a sampling rate of 13.5 M samples per second.
|
|
#14
09-21-2022, 10:42 PM
|
||||
|
||||
|
By the way, the scanning line structure of the analog picture samples the vertical resolution frequencies. 480 active lines (in NTSC) gives a practical limit of 330 lines per picture height of resolution without aliasing (and interlace flicker) getting too objectionable. This is a balanced spatial resolution for a 4x3 aspect ratio picture:
440 lines per width is the same physical spacing as 330 lines per height.
|
|
#15
09-21-2022, 10:46 PM
|
||||
|
||||
|
Extensive discussion of the above factors:
http://videokarma.org/showthread.php...ht=kell+factor
|
| Audiokarma |
 |
|
|


 Linear Mode

