
|
|
|
#1
 09-20-2022, 06:47 PM
|
|||
|
|||
|
How to read VCR signal layout
Hello! I am new here! I am interested in all things video, in particular old analog video recorders and cameras, as well as digital camcorders. I have a YouTube channel, but I don't want to advertise it now, as it may seem way too amateurish to the members.
Several of my late videos regarded analog VTRs, and the deeper I get into why and how some of them are better/worse than others, and what the differences are, the deeper I get into their specs and into how they work. I've never studied electronics, so understanding some things is hard, especially when several things happen at once, like modulating of this with this, and all this occurs in time. Reading a bit about analog broadcast TV, I think I understand where the bandwidth requirement comes from, it is basically number of elements ("pixels") in line times the number of lines times the number of frames per second, so about 6 or 7 or 8 MHz depending on a system. Do I understand correctly, that on the picture below each particular frequency describes a pixel, and amplitude describes brightness? So, basically, the picture below can define a whole second of broadcast video, or in other terms, a whole frame? (Or field, whatever, not important at this point). 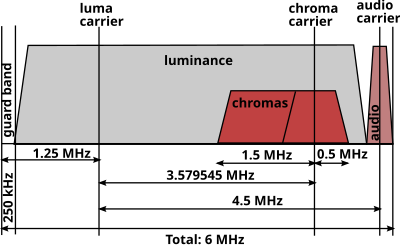 Moving on to VTR, I have a question of how to read the signal graph of a typical "color-under" VTR: 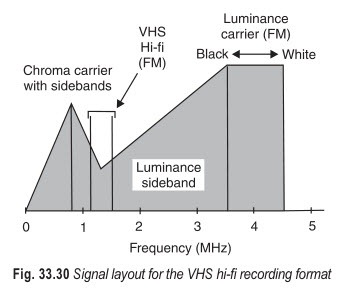 Does it describe a whole frame/field, or a single pixel? From what I've read, brightness of a pixel is not described with amplitude, but rather with frequency, so the range from luminance tip (black) and white frequency describe brightness range. So, a range between, say, 3.5 MHz and 4.5 MHz, which is 1 MHz, describes the whole range of brightness... for a single pixel? For a pair of pixels? What is luminance sideband is for in this case? On another hand, I read about, say, VHS, that it has deviation of 1 MHz, but luma range of 3 MHz. Ok, what does it tell me? In other place I read that for analog television resolution can be calculated as roughly 80 LWPH per 1 MHz, so 3 MHz means 240 lines, it adds up. But how exactly to read this information on the graph? If I divide 1,000,000/480/30 = 70, which is close to 80. Is it where this number comes from? But in this case this means that bandwidth describes one scanline. So, the graph can be considered a "photo" of one scanline sweep, where sweeping from left edge of the screen to the right corresponds to frequencies from the left edge of the luminance band to the right? Is this correct? But in this case how do describe brightness for all of these pixels, if brightness is described as frequency in the 3.5 to 4.5 region, so I can have only one frequency there for every moment it time? I am lost here. If someone can explain it in layman terms, I would be very grateful! Another thing, which is related to these graphs, is increase in resolution in "hi-band" formats. This is why I started to look into these graphs at the first place. For formats like SVHS, Hi8, SuperBeta, Umatic SP some of these things have been done:
Thanks! 
|
|
|


 Threaded Mode